1743 Students
Microsoft Excel 2019 for Beginner introduces the essential tools needed to create, organise, calculate, format, and manage spreadsheets. Learners explore the Excel interface, data entry, formulas, functions, worksheets, workbooks, charts, and basic data analysis. It is suitable for beginners, office workers, administrators, students, and anyone developing everyday spreadsheet skills. The course progresses into useful techniques including PivotTables, PivotCharts, lookup functions, …
Microsoft Excel 2019 for Beginner introduces the essential tools needed to create, organise, calculate, format, and manage spreadsheets. Learners explore the Excel interface, data entry, formulas, functions, worksheets, workbooks, charts, and basic data analysis. It is suitable for beginners, office workers, administrators, students, and anyone developing everyday spreadsheet skills.
The course progresses into useful techniques including PivotTables, PivotCharts, lookup functions, formula auditing, workbook protection, forecasting, templates, sparklines, and mapping data. These skills can support reporting, record keeping, data analysis, tracking information, and presenting figures clearly across Canadian workplaces.
Study online at a convenient pace with structured lessons designed to build confidence step by step. By completing the training, you can strengthen your Excel knowledge and add a valuable digital skill to your workplace toolkit, particularly for administration, finance, data entry, customer service, and office-based roles.
The course helps learners build confidence with Excel 2019 through a structured introduction to everyday spreadsheet tasks and data management.
This course is designed for beginners who want to develop practical Excel knowledge for study, work, or everyday data management.
Excel remains a useful workplace tool across many Canadian industries, from administration and retail to finance, education, healthcare, and business operations.
Excel skills can complement many administrative, business, and data-focused roles. Salary ranges vary depending on province, employer, experience, industry, and additional qualifications.
The course is designed for beginners and does not require previous Excel qualifications or advanced computer experience.
All of our courses, including this Microsoft Excel 2019 for Beginner, are fully accredited, providing you with up-to-date skills and knowledge and helping you to become more competent and effective in your chosen field.
All of our courses are accredited by the CPD Certification Service as conforming to universally accepted Continuing Professional Development (CPD) guidelines.

The Quality Licence Scheme (QLS) is a trusted endorsement framework that certifies high-quality, non-regulated training programmes across various sectors.

The Association of Healthcare Trainers (AoHT) promotes high-quality healthcare training, supporting providers to deliver relevant, industry-aligned education and improve professional standards.

Once you’ve successfully completed your course, you will immediately be sent a digital certificate. Also, you can have your printed certificate delivered by post (shipping cost CA$9.99). All of our courses are fully accredited, providing you with up-to-date skills and knowledge and helping you to become more competent and effective in your chosen field.
The detailed curriculum outline of our Microsoft Excel 2019 for Beginner is as follows
Get familiar with the Excel 2019 environment and the features that make spreadsheet work more organised and efficient. This provides a starting point before moving into everyday Excel tasks.
Learn your way around workbooks, worksheets, rows, columns, cells, the Ribbon, Name Box, and Formula Bar. You will also practise entering and managing basic spreadsheet information.
Turn Excel into a useful calculation tool by working with formulas, mathematical operators, and cell references. The focus is on building confidence with calculations rather than relying on manual working.
Discover how to edit worksheet content, adjust rows and columns, move information, and make changes efficiently. These basic editing skills are useful in almost every Excel task.
Make spreadsheet information easier to read and understand through appropriate formatting. You will explore fonts, alignment, borders, number formats, and other worksheet presentation options.
Learn how to prepare spreadsheets for printing and control how information appears on the page. Topics include print settings, page layout, and preparing worksheets for clearer output.
Build better file-management habits by working with Excel workbooks and their different components. You will learn how to save, organise, and manage spreadsheet files effectively.
Go beyond basic calculations by using Excel functions to work with information more efficiently. Common functions can help automate calculations and reduce repetitive manual work.
Learn how Excel can be used to organise lists and structured information. The section introduces techniques that make larger sets of records easier to manage and work with.
Explore Excel tools that can help you identify useful information within a dataset. Learners develop an understanding of sorting, filtering, and other approaches to reviewing spreadsheet data.
Charts can make numbers easier to understand at a glance. You will learn how to create and work with charts to present spreadsheet information in a clearer visual format.
Discover how PivotTables can summarise larger amounts of information and make patterns easier to examine. PivotCharts extend this by presenting summaries visually.
Learn how to work across different worksheets and workbooks without losing track of information. This is particularly useful when managing related datasets or larger projects.
Develop your spreadsheet skills by exploring lookup functions and tools for checking formulas. These features can help you retrieve information and identify potential formula problems.
Understand ways to share Excel files while maintaining better control over their contents. Workbook and worksheet protection features can help prevent unwanted changes to important information.
Explore ways to reduce repetitive spreadsheet tasks and make workbook processes more efficient. The section introduces automation concepts that can save time when working with recurring tasks.
Use sparklines to show quick trends within cells and explore mapping features for presenting location-based information. These tools add alternative ways to communicate data.
Learn how Excel can be used to examine patterns and make forecasts from existing information. This provides an introduction to using spreadsheet data for forward-looking analysis.
Finish by exploring templates that can provide ready-made structures for common spreadsheet tasks. Using templates can help save time and provide a consistent starting point for new workbooks.
You will learn how to create and manage workbooks, enter and format data, perform calculations, use functions, organise lists, analyse information, create charts, work with PivotTables and PivotCharts, use lookup functions, protect workbooks, and explore forecasting tools.
No. Previous Excel experience is not required. The course begins with the basics and builds your knowledge progressively.
Yes. The course can be completed through online learning, allowing you to study the lessons at a convenient pace and fit learning around work, education, or other commitments.
You will learn core skills such as entering data into cells, adjusting rows and columns, formatting worksheets, creating formulas, using functions, managing worksheets, saving workbooks, and preparing spreadsheets for printing.
The course introduces learners to calculations and functions used for working with spreadsheet data. You will also explore lookup functions and formula auditing to help retrieve information and check formulas.
Yes. Excel is commonly used for tasks such as record keeping, reporting, budgeting, data entry, scheduling, inventory tracking, and information analysis. Excel knowledge can complement roles in administration, finance, customer service, data entry, business operations, and other office-based areas.
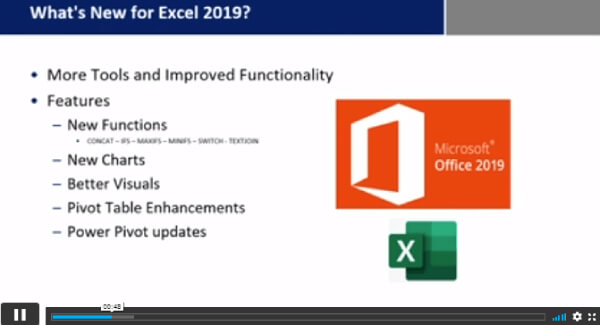
| Microsoft Excel 2019 New Features | |||
| Introduction to Microsoft Excel 2019 New Features | 00:07:00 | ||
| CONCAT | 00:02:00 | ||
| IFS | 00:01:00 | ||
| MAXIFS | 00:01:00 | ||
| MINIFS | 00:01:00 | ||
| SWITCH | 00:02:00 | ||
| TEXTJOIN | 00:01:00 | ||
| Map Chart | 00:02:00 | ||
| Funnel Chart | 00:01:00 | ||
| Better Visuals | 00:06:00 | ||
| Pivot Table Enhancements | 00:02:00 | ||
| Power Pivot Updates | 00:01:00 | ||
| Getting Started with Microsoft Office Excel | |||
| Navigate the Excel User Interface | 00:28:00 | ||
| Use Excel Commands | 00:10:00 | ||
| Create and Save a Basic Workbook | 00:19:00 | ||
| Enter Cell Data | 00:12:00 | ||
| Use Excel Help | 00:05:00 | ||
| Performing Calculations | |||
| Create Worksheet Formulas | 00:15:00 | ||
| Insert Functions | 00:17:00 | ||
| Reuse Formulas and Functions | 00:17:00 | ||
| Modifying a Worksheet | |||
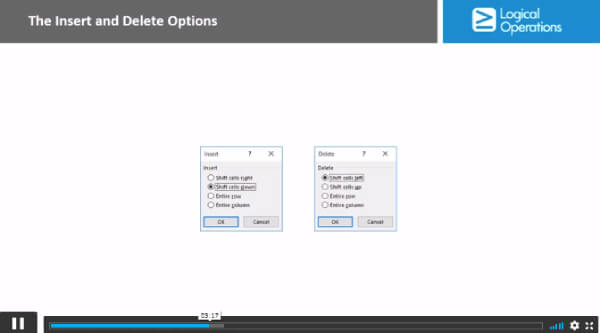
| Insert, Delete, and Adjust Cells, Columns, and Rows | 00:10:00 | ||
| Search for and Replace Data | 00:09:00 | ||
| Use Proofing and Research Tools | 00:07:00 | ||
| Formatting a Worksheet | |||
| Apply Text Formats | 00:16:00 | ||
| Apply Number Format | 00:08:00 | ||
| Align Cell Contents | 00:09:00 | ||
| Apply Styles and Themes | 00:12:00 | ||
| Apply Basic Conditional Formatting | 00:11:00 | ||
| Create and Use Templates | 00:08:00 | ||
| Printing Workbooks | |||
| Preview and Print a Workbook | 00:10:00 | ||
| Set Up the Page Layout | 00:09:00 | ||
| Configure Headers and Footers | 00:07:00 | ||
| Managing Workbooks | |||
| Manage Worksheets | 00:05:00 | ||
| Manage Workbook and Worksheet Views | 00:07:00 | ||
| Manage Workbook Properties | 00:06:00 | ||
| Working with Functions | |||
| Work with Ranges | 00:18:00 | ||
| Use Specialized Functions | 00:12:00 | ||
| Work with Logical Functions | 00:24:00 | ||
| Work with Date & Time Functions | 00:08:00 | ||
| Work with Text Functions | 00:11:00 | ||
| Working with Lists | |||
| Sort Data | 00:10:00 | ||
| Filter Data | 00:10:00 | ||
| Query Data with Database Functions | 00:09:00 | ||
| Outline and Subtotal Data | 00:09:00 | ||
| Analyzing Data | |||
| Apply Intermediate Conditional Formatting | 00:07:00 | ||
| Apply Advanced Conditional Formatting | 00:06:00 | ||
| Visualizing Data with Charts | |||
| Create Charts | 00:13:00 | ||
| Modify and Format Charts | 00:12:00 | ||
| Use Advanced Chart Features | 00:13:00 | ||
| Using PivotTables and PivotCharts | |||
| Create a PivotTable | 00:13:00 | ||
| Analyze PivotTable Data | 00:12:00 | ||
| Present Data with PivotCharts | 00:08:00 | ||
| Filter Data by Using Timelines and Slicers | 00:11:00 | ||
| Working with Multiple Worksheets and Workbooks | |||
| Use Links and External References | 00:12:00 | ||
| Use 3-D References | 00:06:00 | ||
| Consolidate Data | 00:06:00 | ||
| Using Lookup Functions and Formula Auditing | |||
| Use Lookup Functions | 00:13:00 | ||
| Trace Cells | 00:09:00 | ||
| Watch and Evaluate Formulas | 00:09:00 | ||
| Sharing and Protecting Workbooks | |||
| Collaborate on a Workbook | 00:20:00 | ||
| Protect Worksheets and Workbooks | 00:08:00 | ||
| Automating Workbook Functionality | |||
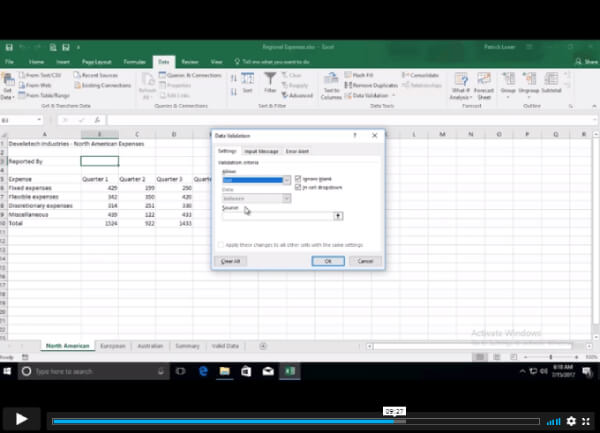
| Apply Data Validation | 00:13:00 | ||
| Search for Invalid Data and Formulas with Errors | 00:04:00 | ||
| Work with Macros | 00:18:00 | ||
| Creating Sparklines and Mapping Data | |||
| Create Sparklines | 00:07:00 | ||
| MapData | 00:07:00 | ||
| Forecasting Data | |||
| Determine Potential Outcomes Using Data Tables | 00:09:00 | ||
| Determine Potential Outcomes Using Scenarios | 00:09:00 | ||
| Use the Goal Seek Feature | 00:04:00 | ||
| Forecasting Data Trends | 00:06:00 | ||
| Excel Templates | |||
| Excel Templates | 00:00:00 | ||
| Assignment | |||
| Assignment – Microsoft Excel | 00:05:00 | ||
$125 Original price was: $125.$20Current price is: $20. ex VAT
SAVE 84% - OFFER ENDS SOON
![]() |
Endorsed Certificate of Compleiton