336 Students
Data drives decision-making across Canadian businesses, healthcare organisations, government departments, financial institutions, and non-profit sectors. This Data Analysis in Excel course is designed to help learners develop the skills needed to organise, analyse, and interpret data using one of the most widely used business tools in Canada. Whether you are new to data analysis or looking to strengthen your spreadsheet …

Data drives decision-making across Canadian businesses, healthcare organisations, government departments, financial institutions, and non-profit sectors. This Data Analysis in Excel course is designed to help learners develop the skills needed to organise, analyse, and interpret data using one of the most widely used business tools in Canada. Whether you are new to data analysis or looking to strengthen your spreadsheet capabilities, this course provides a structured learning path.
Suitable for both beginners and existing employees, the course covers data management, visualisation, forecasting, PivotTables, lookup functions, and automation techniques. These skills can be applied in administrative, finance, operations, healthcare, retail, education, and business support roles throughout Canada.
With flexible online learning and self-paced study, you can build valuable Excel expertise around your schedule. Upon completion, you will receive a certificate that supports your learning and career development. Enrol today and strengthen your data analysis skills with confidence.
Please note: This Data Analysis in Excel Course only gives you the theoretical knowledge that you need to excel in this field. This Course doesn’t entitle you to practise as a professional in this specific field.
This course is ideal for:
All of our courses, including this Data Analysis in Excel Course, are fully accredited, providing you with up-to-date skills and knowledge and helping you to become more competent and effective in your chosen field.
All of our courses are accredited by the CPD Quality Standards as conforming to universally accepted Continuing Professional Development (CPD) guidelines.

The Quality Licence Scheme (QLS) is a trusted endorsement framework that certifies high-quality, non-regulated training programmes across various sectors.

The Association of Healthcare Trainers (AoHT) promotes high-quality healthcare training, supporting providers to deliver relevant, industry-aligned education and improve professional standards.

Once you’ve successfully completed your course, you will immediately be sent a digital certificate. Also, you can have your printed certificate delivered by post (shipping cost CA$9.99). All of our courses are fully accredited, providing you with up-to-date skills and knowledge and helping you to become more competent and effective in your chosen field.
Start by learning how to edit and organise Excel worksheets efficiently. This module covers formatting, managing worksheet content, and improving spreadsheet structure for better usability.
Discover how to manage data lists effectively using sorting, filtering, and data organisation techniques. You’ll learn methods that help keep information accurate and easy to analyse.
Explore key analytical tools within Excel that help identify trends, patterns, and meaningful insights. This module focuses on transforming raw data into useful business information.
Learn how to present information clearly through a variety of chart types. You’ll discover how visual reporting can improve communication and support data-driven decisions.
Take large datasets and turn them into easy-to-understand summaries. This section demonstrates how PivotTables and PivotCharts can simplify complex reporting tasks.
Managing information across multiple files becomes easier with the techniques covered here. Learn how to link, organise, and maintain consistency between worksheets and workbooks.
Build confidence with powerful lookup functions used in everyday business analysis. The module also introduces auditing tools that help identify and correct formula errors.
Reduce repetitive tasks by exploring Excel automation features. You’ll learn techniques that improve efficiency and streamline common spreadsheet processes.
Enhance reports with compact visual indicators and geographic data displays. This module shows how to make data easier to understand at a glance.
Finish the course by exploring forecasting tools that help predict future trends. Learn how businesses and organisations use historical data to support planning and decision-making.
Yes. The course is designed for learners with little or no prior experience using Excel for data analysis.
No. The course starts with foundational spreadsheet skills before progressing to more advanced analytical features.
Excel remains one of the most widely used business tools in Canada, making data analysis skills valuable across many industries and job roles.
Yes. The course includes dedicated modules covering PivotTables, PivotCharts, charts, and other visual reporting tools.
Yes. The online learning format allows you to progress through the course according to your schedule.
These skills are commonly used in business, finance, healthcare, education, retail, government, logistics, and many other sectors throughout Canada.
| Modifying a Worksheet | |||
| Insert, Delete, and Adjust Cells, Columns, and Rows | 00:10:00 | ||
| Search for and Replace Data | 00:09:00 | ||
| Use Proofing and Research Tools | 00:07:00 | ||
| Working with Lists | |||
| Sort Data | 00:10:00 | ||
| Filter Data | 00:10:00 | ||
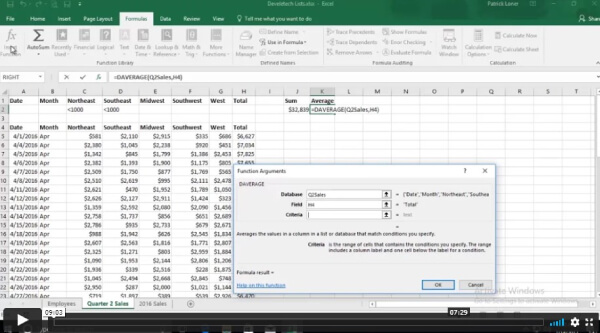
| Query Data with Database Functions | 00:09:00 | ||
| Outline and Subtotal Data | 00:09:00 | ||
| Analyzing Data | |||
| Apply Intermediate Conditional Formatting | 00:07:00 | ||
| Apply Advanced Conditional Formatting | 00:06:00 | ||
| Visualizing Data with Charts | |||
| Create Charts | 00:13:00 | ||
| Modify and Format Charts | 00:12:00 | ||
| Use Advanced Chart Features | 00:13:00 | ||
| Using PivotTables and PivotCharts | |||
| Create a PivotTable | 00:13:00 | ||
| Analyze PivotTable Data | 00:12:00 | ||
| Present Data with PivotCharts | 00:08:00 | ||
| Filter Data by Using Timelines and Slicers | 00:11:00 | ||
| Working with Multiple Worksheets and Workbooks | |||
| Use Links and External References | 00:12:00 | ||
| Use 3-D References | 00:06:00 | ||
| Consolidate Data | 00:06:00 | ||
| Using Lookup Functions and Formula Auditing | |||
| Use Lookup Functions | 00:13:00 | ||
| Trace Cells | 00:09:00 | ||
| Watch and Evaluate Formulas | 00:09:00 | ||
| Automating Workbook Functionality | |||
| Apply Data Validation | 00:13:00 | ||
| Search for Invalid Data and Formulas with Errors | 00:04:00 | ||
| Work with Macros | 00:18:00 | ||
| Creating Sparklines and Mapping Data | |||
| Create Sparklines | 00:07:00 | ||
| MapData | 00:07:00 | ||
| Forecasting Data | |||
| Determine Potential Outcomes Using Data Tables | 00:09:00 | ||
| Determine Potential Outcomes Using Scenarios | 00:09:00 | ||
| Use the Goal Seek Feature | 00:04:00 | ||
| Forecasting Data Trends | 00:06:00 | ||
$125 Original price was: $125.$20Current price is: $20. ex VAT
SAVE 84% - OFFER ENDS SOON
![]() |
01 Year of full Course access
Level 5
Endorsed Certificate of Compleiton