Microsoft Excel
 304 Students
Microsoft Excel is a widely used tool for organising, analysing, and presenting data across many industries. This course is designed to help learners build a strong understanding of Excel 2019, starting from the basics and progressing to more advanced features such as data analysis, charts, PivotTables, and automation. The course covers essential topics including calculations, formatting, functions, and workbook management, …
Microsoft Excel is a widely used tool for organising, analysing, and presenting data across many industries. This course is designed to help learners build a strong understanding of Excel 2019, starting from the basics and progressing to more advanced features such as data analysis, charts, PivotTables, and automation.
The course covers essential topics including calculations, formatting, functions, and workbook management, along with advanced tools like lookup functions, forecasting, and data visualisation. Learners will explore how to handle data efficiently and present information clearly using structured methods.
With a step-by-step approach, this course supports learners in developing confidence in using Excel for everyday tasks, academic work, and workplace requirements.
- Accredited by CPD
- Instant e-certificate and hard copy dispatch by next working day
- Fully online, interactive course with audio voiceover
- Self-paced learning and laptop, tablet, smartphone-friendly
- 24/7 Learning Assistance
- Discounts on bulk purchases
Learning Outcomes
By the end of this course, learners will be able to:
- Navigate Microsoft Excel and manage worksheets effectively
- Perform calculations using formulas and built-in functions
- Organise and format data for clear presentation
- Analyse data using charts, PivotTables, and lists
- Apply advanced features such as lookup functions and forecasting
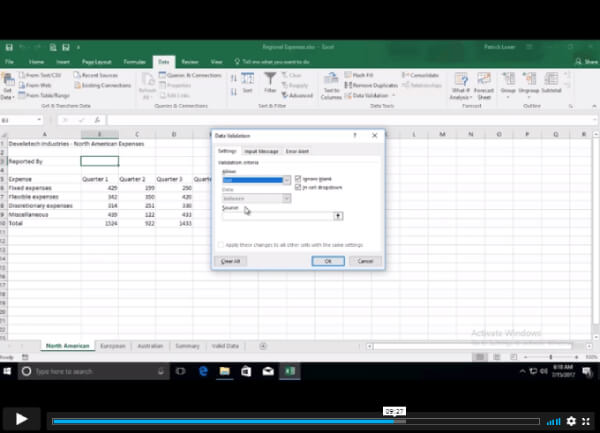
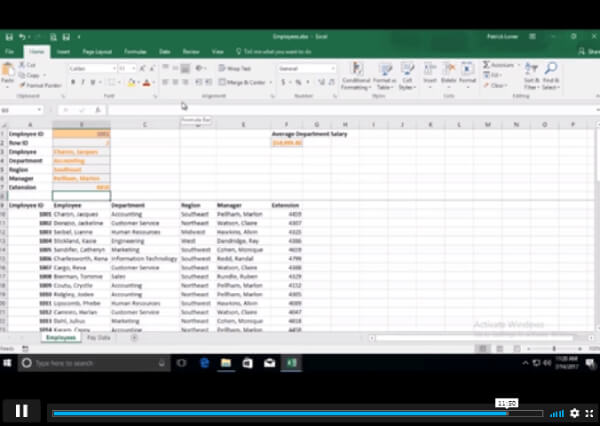
Sneak Peek
Who Should Take the Course
- Beginners with little or no experience in Microsoft Excel
- Students looking to improve their data handling skills
- Office staff and administrators working with spreadsheets
- Individuals aiming to improve accuracy and efficiency in data tasks
- Anyone interested in learning Excel for academic or workplace use
Who should take the course
Anyone with a knack for learning new skills can take this Microsoft Excel. While this comprehensive training is popular for preparing people for job opportunities in the relevant fields, it also helps to advance your career for promotions.
Certification
Once you’ve successfully completed your course, you will immediately be sent a digital certificate. Also, you can have your printed certificate delivered by post (shipping cost £3.99). All of our courses are fully accredited, providing you with up-to-date skills and knowledge and helping you to become more competent and effective in your chosen field. Our certifications have no expiry dates, although we do recommend that you renew them every 12 months.

Accreditation
All of our courses, including this Microsoft Excel, are fully accredited, providing you with up-to-date skills and knowledge and helping you to become more competent and effective in your chosen field.
Career Path
- Data Entry Clerk
- Administrative Assistant
- Office Administrator
- Junior Data Analyst
- Finance Assistant
FAQ
The best course depends on your level. Beginners should start with a basic Excel course covering spreadsheets, formulas, and formatting. Intermediate learners can choose courses focusing on data analysis, PivotTables, and charts, while advanced users should look for courses on automation, macros, and VBA.
A good Excel course usually includes step-by-step lessons, real-life examples, and practice exercises. Courses that cover formulas, data handling, and visualisation tools are considered the most effective for learning Excel properly.
The best way is a mix of learning and practice. Start with basic tutorials, then apply what you learn by creating spreadsheets, using formulas, and analysing data. Regular practice is key to improving quickly.
Excel classes can range from free to around £200 or more, depending on the level and provider. Basic online courses are often low-cost or free, while advanced or certified training programmes tend to be more expensive.
Yes, you can learn Excel for free through online tutorials, videos, and free courses. Many platforms offer beginner to intermediate lessons without any cost.
- Entering and formatting data
- Using basic formulas (SUM, AVERAGE)
- Creating simple charts
- Sorting and filtering data
- Using basic functions and cell references
If you want, I can suggest a step-by-step learning plan or the best courses based on your level.
Course Curriculum
The detailed curriculum outline of our Microsoft Excel is as follows:
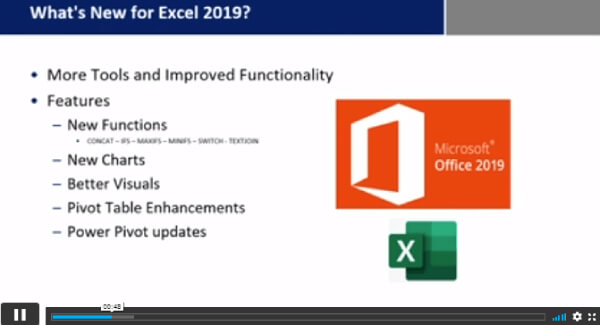
Microsoft Excel 2019 New Features
- Introduction to Microsoft Excel 2019 New Features
- CONCAT
- IFS
- MAXIFS
- MINIFS
- SWITCH
- TEXTJOIN
- Map Chart
- Funnel Chart
- Better Visuals
- Pivot Table Enhancements
- Power Pivot Updates
Getting Started with Microsoft Office Excel
- Navigate the Excel User Interface
- Use Excel Commands
- Create and Save a Basic Workbook
- Enter Cell Data
- Use Excel Help
Performing Calculations
- Create Worksheet Formulas
- Insert Functions
- Reuse Formulas and Functions
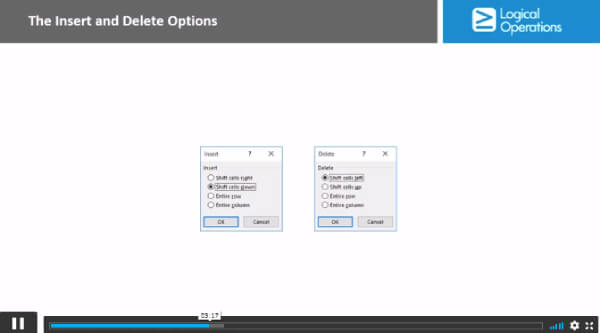
Modifying a Worksheet
- Insert, Delete, and Adjust Cells, Columns, and Rows
- Search for and Replace Data
- Use Proofing and Research Tools
Formatting a Worksheet
- Apply Text Formats
- Apply Number Format
- Align Cell Contents
- Apply Styles and Themes
- Apply Basic Conditional Formatting
- Create and Use Templates
Printing Workbooks
- Preview and Print a Workbook
- Set Up the Page Layout
- Configure Headers and Footers
Managing Workbooks
- Manage Worksheets
- Manage Workbook and Worksheet Views
- Manage Workbook Properties
Working with Functions
Work with Ranges
Use Specialized Functions
Work with Logical Functions
Work with Date & Time Functions
Work with Text Functions
Working with Lists
- Sort Data
- Filter Data
- Query Data with Database Functions
- Outline and Subtotal Data
Analyzing Data
- Apply Intermediate Conditional Formatting
- Apply Advanced Conditional Formatting
Visualizing Data with Charts
- Create Charts
- Modify and Format Charts
- Use Advanced Chart Features
Using PivotTables and PivotCharts
- Create a PivotTable
- Analyze PivotTable Data
- Present Data with PivotCharts
- Filter Data by Using Timelines and Slicers
Working with Multiple Worksheets and Workbooks
- Use Links and External References
- Use 3-D References
- Consolidate Data
Using Lookup Functions and Formula Auditing
- Use Lookup Functions
- Trace Cells
- Watch and Evaluate Formulas
Sharing and Protecting Workbooks
- Collaborate on a Workbook
- Protect Worksheets and Workbooks
Automating Workbook Functionality
- Apply Data Validation
- Search for Invalid Data and Formulas with Errors
- Work with Macros
Creating Sparklines and Mapping Data
- Create Sparklines
- MapData
Forecasting Data
- Determine Potential Outcomes Using Data Tables
- Determine Potential Outcomes Using Scenarios
- Use the Goal Seek Feature
- Forecasting Data Trends
Excel Templates
- Excel Templates
Course Curriculum
| Microsoft Excel 2019 New Features | |||
| Introduction to Microsoft Excel 2019 New Features | 00:07:00 | ||
| CONCAT | 00:02:00 | ||
| IFS | 00:01:00 | ||
| MAXIFS | 00:01:00 | ||
| MINIFS | 00:01:00 | ||
| SWITCH | 00:02:00 | ||
| TEXTJOIN | 00:01:00 | ||
| Map Chart | 00:02:00 | ||
| Funnel Chart | 00:01:00 | ||
| Better Visuals | 00:06:00 | ||
| Pivot Table Enhancements | 00:02:00 | ||
| Power Pivot Updates | 00:01:00 | ||
| Getting Started with Microsoft Office Excel | |||
| Navigate the Excel User Interface | 00:28:00 | ||
| Use Excel Commands | 00:10:00 | ||
| Create and Save a Basic Workbook | 00:19:00 | ||
| Enter Cell Data | 00:12:00 | ||
| Use Excel Help | 00:05:00 | ||
| Performing Calculations | |||
| Create Worksheet Formulas | 00:15:00 | ||
| Insert Functions | 00:17:00 | ||
| Reuse Formulas and Functions | 00:17:00 | ||
| Modifying a Worksheet | |||
| Insert, Delete, and Adjust Cells, Columns, and Rows | 00:10:00 | ||
| Search for and Replace Data | 00:09:00 | ||
| Use Proofing and Research Tools | 00:07:00 | ||
| Formatting a Worksheet | |||
| Apply Text Formats | 00:16:00 | ||
| Apply Number Format | 00:08:00 | ||
| Align Cell Contents | 00:09:00 | ||
| Apply Styles and Themes | 00:12:00 | ||
| Apply Basic Conditional Formatting | 00:11:00 | ||
| Create and Use Templates | 00:08:00 | ||
| Printing Workbooks | |||
| Preview and Print a Workbook | 00:10:00 | ||
| Set Up the Page Layout | 00:09:00 | ||
| Configure Headers and Footers | 00:07:00 | ||
| Managing Workbooks | |||
| Manage Worksheets | 00:05:00 | ||
| Manage Workbook and Worksheet Views | 00:07:00 | ||
| Manage Workbook Properties | 00:06:00 | ||
| Working with Functions | |||
| Work with Ranges | 00:18:00 | ||
| Use Specialized Functions | 00:12:00 | ||
| Work with Logical Functions | 00:24:00 | ||
| Work with Date & Time Functions | 00:08:00 | ||
| Work with Text Functions | 00:11:00 | ||
| Working with Lists | |||
| Sort Data | 00:10:00 | ||
| Filter Data | 00:10:00 | ||
| Query Data with Database Functions | 00:09:00 | ||
| Outline and Subtotal Data | 00:09:00 | ||
| Analyzing Data | |||
| Apply Intermediate Conditional Formatting | 00:07:00 | ||
| Apply Advanced Conditional Formatting | 00:06:00 | ||
| Visualizing Data with Charts | |||
| Create Charts | 00:13:00 | ||
| Modify and Format Charts | 00:12:00 | ||
| Use Advanced Chart Features | 00:13:00 | ||
| Using PivotTables and PivotCharts | |||
| Create a PivotTable | 00:13:00 | ||
| Analyze PivotTable Data | 00:12:00 | ||
| Present Data with PivotCharts | 00:08:00 | ||
| Filter Data by Using Timelines and Slicers | 00:11:00 | ||
| Working with Multiple Worksheets and Workbooks | |||
| Use Links and External References | 00:12:00 | ||
| Use 3-D References | 00:06:00 | ||
| Consolidate Data | 00:06:00 | ||
| Using Lookup Functions and Formula Auditing | |||
| Use Lookup Functions | 00:13:00 | ||
| Trace Cells | 00:09:00 | ||
| Watch and Evaluate Formulas | 00:09:00 | ||
| Sharing and Protecting Workbooks | |||
| Collaborate on a Workbook | 00:20:00 | ||
| Protect Worksheets and Workbooks | 00:08:00 | ||
| Automating Workbook Functionality | |||
| Apply Data Validation | 00:13:00 | ||
| Search for Invalid Data and Formulas with Errors | 00:04:00 | ||
| Work with Macros | 00:18:00 | ||
| Creating Sparklines and Mapping Data | |||
| Create Sparklines | 00:07:00 | ||
| MapData | 00:07:00 | ||
| Forecasting Data | |||
| Determine Potential Outcomes Using Data Tables | 00:09:00 | ||
| Determine Potential Outcomes Using Scenarios | 00:09:00 | ||
| Use the Goal Seek Feature | 00:04:00 | ||
| Forecasting Data Trends | 00:06:00 | ||
| Excel Templates | |||
| Excel Templates | 00:00:00 | ||
| Assignment | |||
| Assignment – Microsoft Excel | 00:05:00 | ||
| Trust Pilot Review | |||
| Trust Pilot Review | 00:00:00 | ||


$125 Original price was: $125.$20Current price is: $20. ex VAT
SAVE 84% - OFFER ENDS SOON
 |
 Take All course
for $99
Take All course
for $99-
 01 Year of full Course access
 -
 Level 3
-
 Endorsed Certificate of Compleiton
-
 10 hours, 55 minutes of total Unit + Quiz duration
Buying more than one of the same courses?
- 50% discount for orders of 10+ courses
- 60% discount for orders of 50+ courses
- 70% discount for orders of 100+ courses
